Leonardo of Pisa (aka –Fibonacci) was one of the greatest European Mathematicians of the middle ages. He was one of the first people to introduce the Hindu-Arabic number system into Europe. His book on how to do arithmetic in the decimal system, called Liber abbaci completed in 1202 persuaded many European mathematicians to use this “new” system.
The Fibonacci retracement is the potential retracement of stock’s original move in price. Fibonacci retracements use horizontal lines to indicate areas of support or resistance at the key Fibonacci levels before it continues in the original direction. These levels are created by drawing trend lines between two extreme points and then dividing the vertical distance by the key Fibonacci ratios of, 38.2%, 50%, and 61.8%
These ratios seem to play an important role in the stock market and can be used to determine critical points that cause a stock’s price to reverse. The direction of the prior trend is likely to continue once the price of the asset has retraced to one of the ratios listed above.
I use Fibonacci retracements as a method of technical analysis in determining critical support/resistance levels. Sometimes I use other retracements(not listed above) if there is a Historical Chart Pattern Comparison (HCPC) that held a specific retracement in the past (i.e. – AAPL found resistance at the 19.1% retracement many weeks back.( https://fitzstock.com/aaplhistorical-comparison/ )
Earlier in April, the IYT held the 38.2% retracement, which I used as my line in the sand. (For current longs)
http://stocktwits.com/message/13394736
http://stocktwits.com/message/13653447
We have been in a raging bull market all year long, but there will be months ahead that these Fib retracements will help us find support in the market. In addition, these Fib support levels will give us defined risk to trade long against, rather then buying the dip blindly (and hoping).
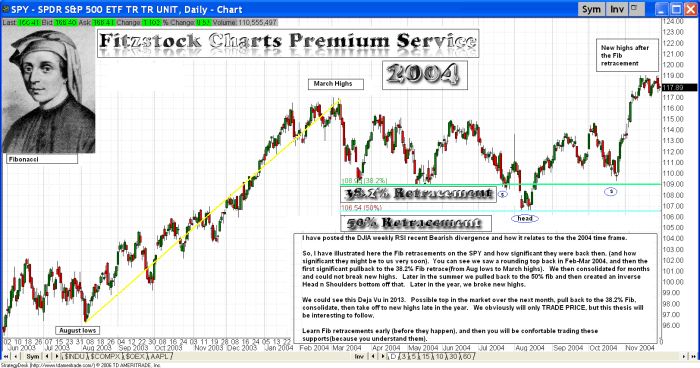
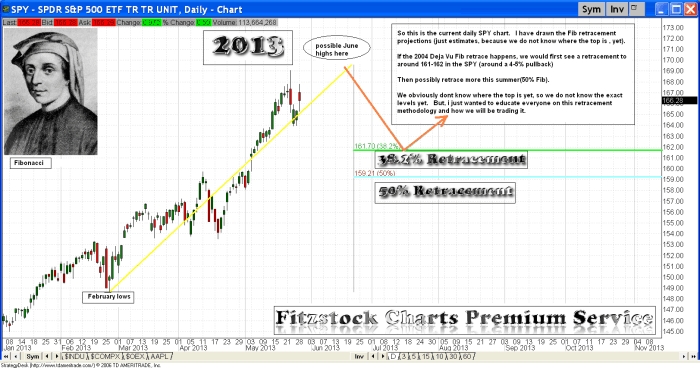
It is essential to understand what a Fibonacci retracement is before it happens. You always need to stay prepared for all circumstance as a trader. This summer we could see a Fib retracement similar to the one seen in 2004. I have posted the 2004 chart below and the current market (2013) to show the hypothetical situation that might arise this summer. (2 chars posted below)


Very interesting thanks for the article.
Do you look at Fib extensions given that everything is making new highs?
I rarely use Fib extensions.
Do you think that today’s close with no follow through selling suggests another leg higher?
It looks exactly like dejavu so far.
It looks like a “rounding top” (as stated earlier)
David
If we follow the 2004 scenario will we see a new high before retracing more to the 50% fib retrace meant?
This is based on the closing on Friday.
Thanks for guidance.
Dont “fall in love” with any Historical Charting Pattern Comparison(HPCP), as they all eventually diverge.
A rounding top(to test new highs) is still on the table.
Hello David,
Thank you very much for the priceless info on trading! Do you use RSI to give you guidance where stocks are heading. Or can you give me a reason why you don’t use it (if so)
I DO NOT use RSI as one of my primary indicators. That is an oversold/overbought oscillator which is ALWAYS trumped by PRICE.