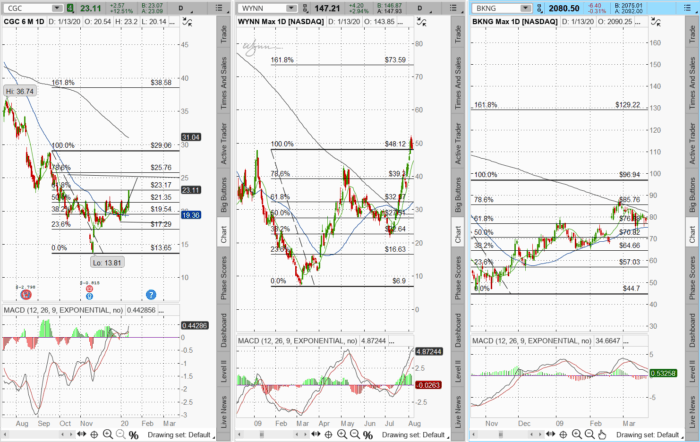
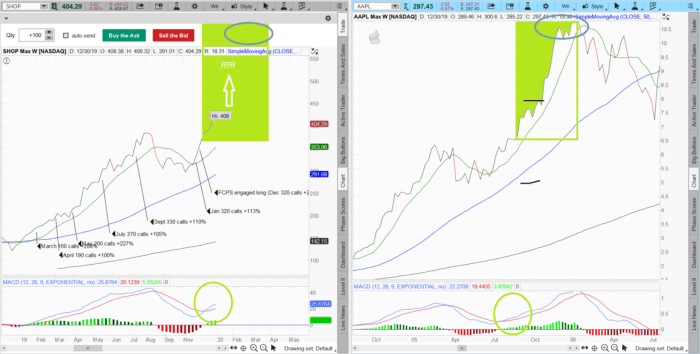
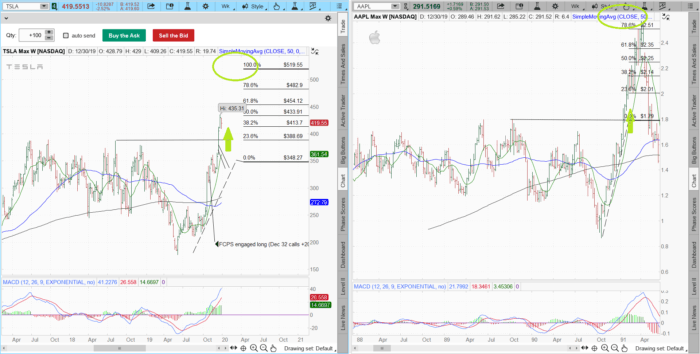
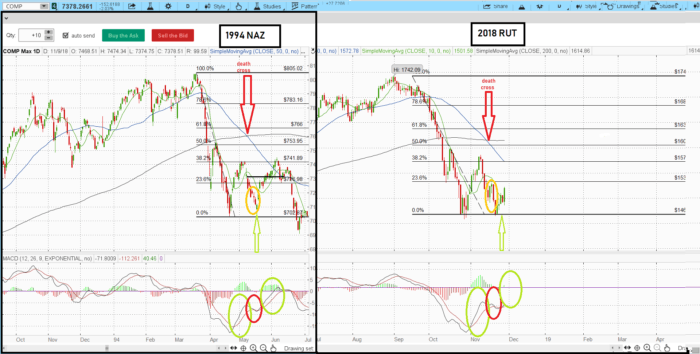
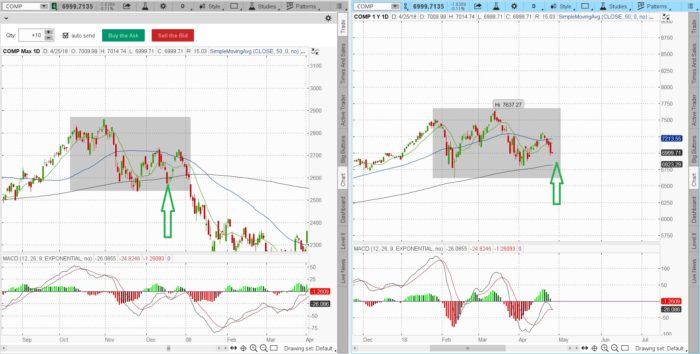
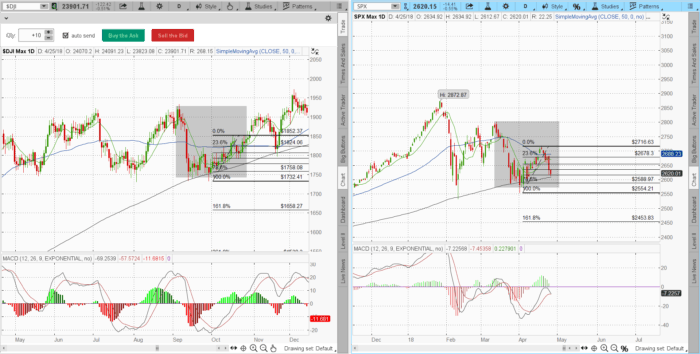
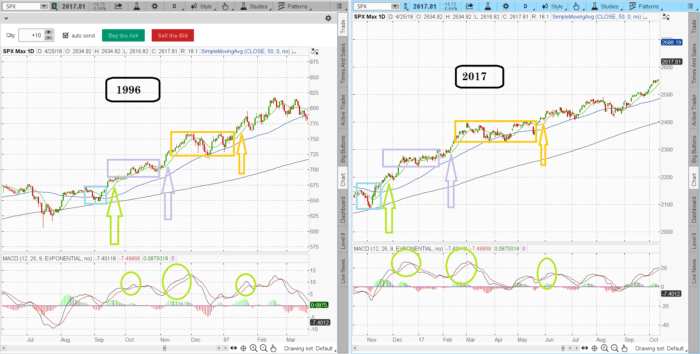
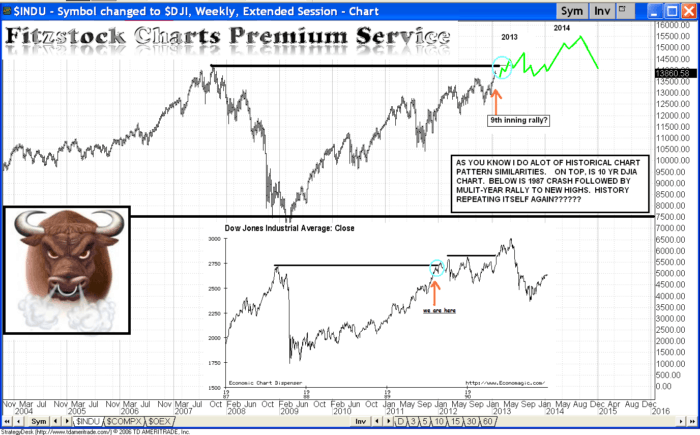
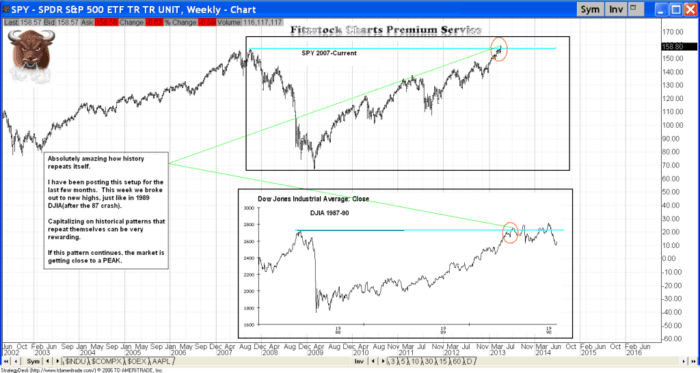
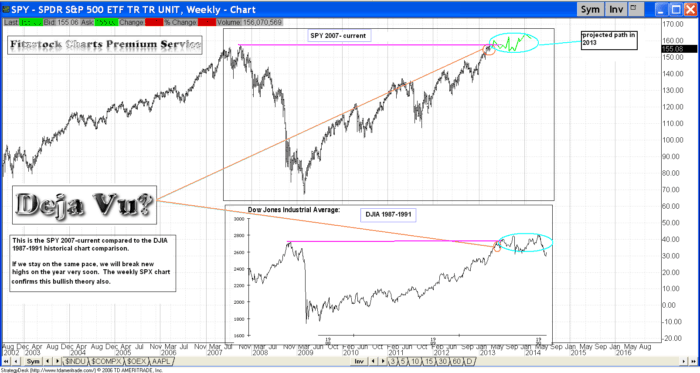
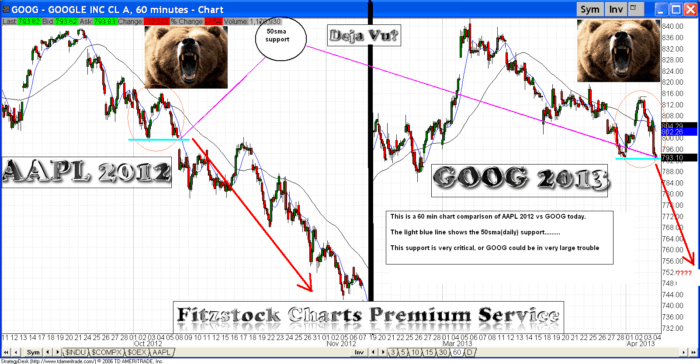
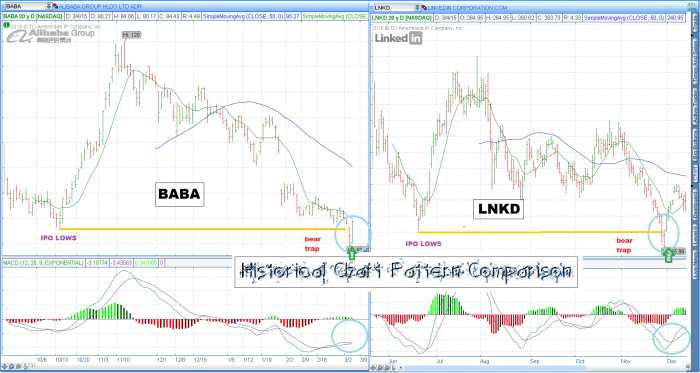
Fitzstock Charts scans thousands of charts searching for price pattern repetition. Many times emotions, psychology and sentiment repeat themselves over time with price structure. We have capitalized on many trades using these Historical Charts Pattern Comparisons (HCPC) incorporated with our trading Rules of Engagements. I have listed some of these analogs below, we were able to capitalize on since launching the service in 2013
2020 HCPC
1980 HCPC
https://fitzstock.com/1980hcpc/
2001 HCPC
https://fitzstock.com/2001-historical-chart-pattern-comparison-update/
AAPL HCPC
https://fitzstock.com/wp-content/uploads/2019/02/2019-02-04-TOS_CHARTS.png
https://fitzstock.com/2019-hcpc-bear-and-bull/
Protected: current HCPC
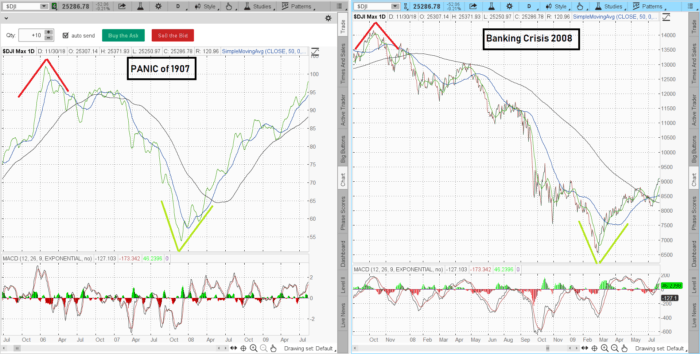
Panic of 1907 vs Banking Crisis 2008
1994 Naz/2018 RUT
Naz 2007/2018
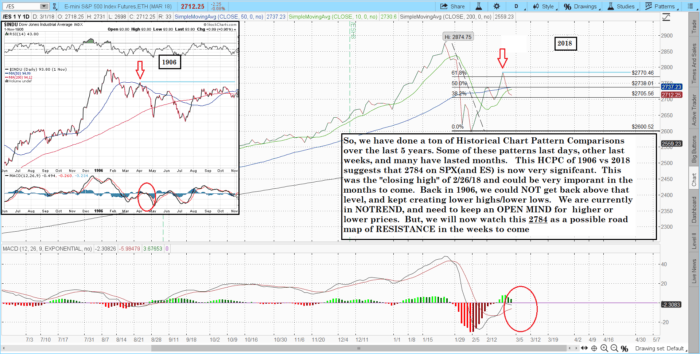
1986/2018
2017/1996HCPC
-posted 2/28/18
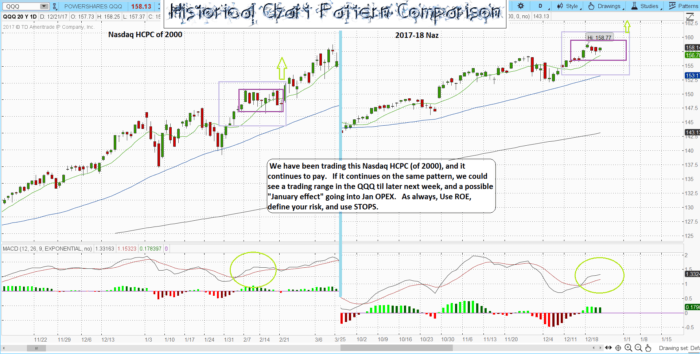
Nasdaq 2000/2017 HCPC
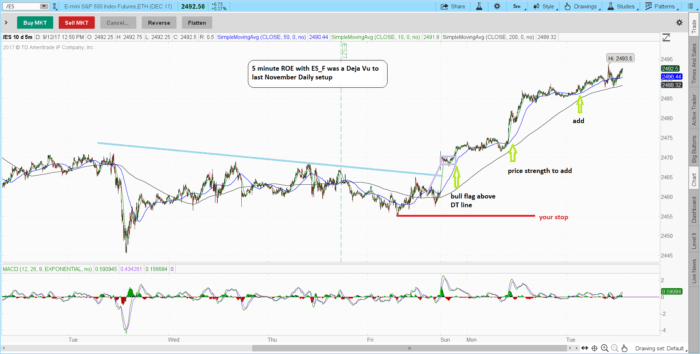
ES_F 11/2016 Daily vs 5 minute ROE 9/2017 (same pattern repeating itself)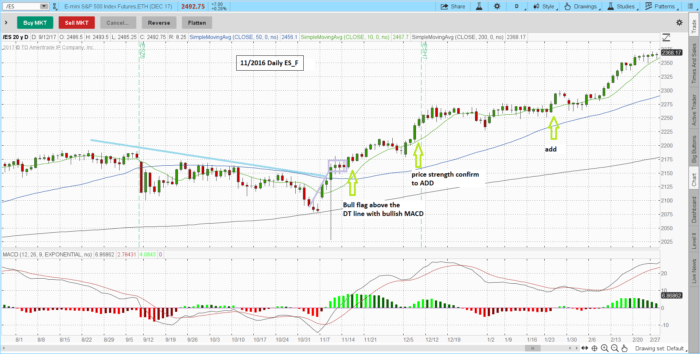
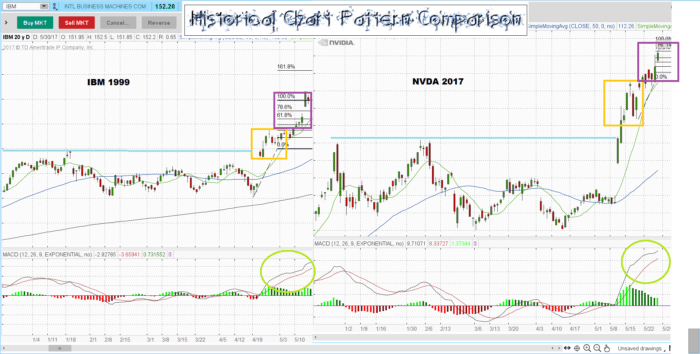
IBM 1999/NVDA 2017
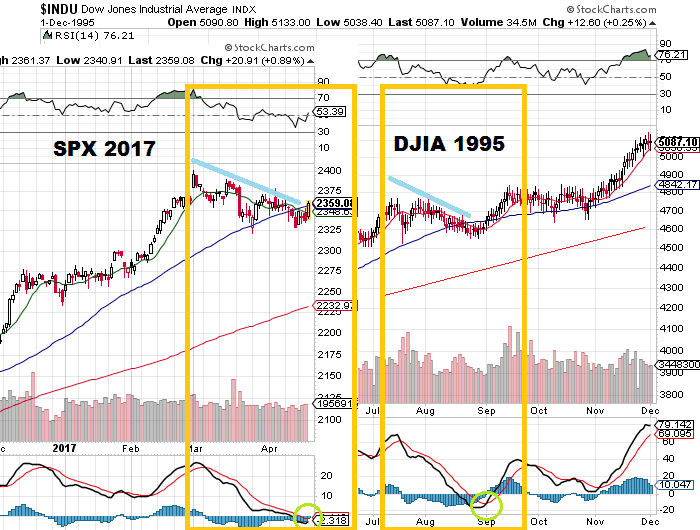
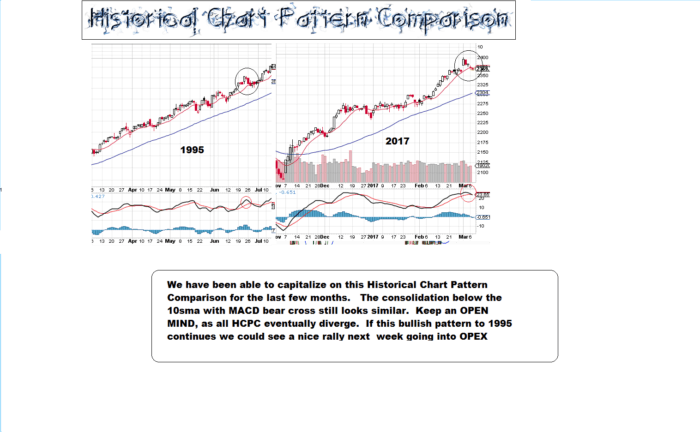
1995/2017 HCPC update
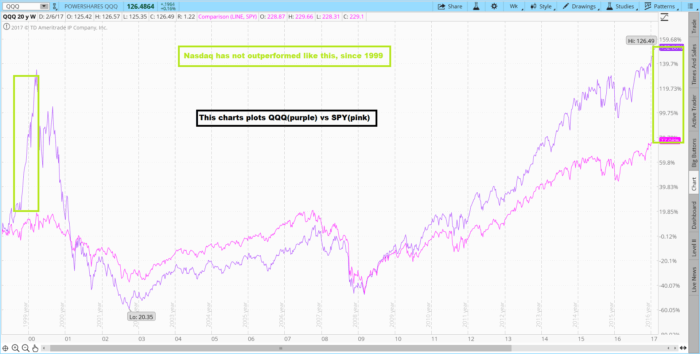
SPY/QQQ divergence expanding like 1999
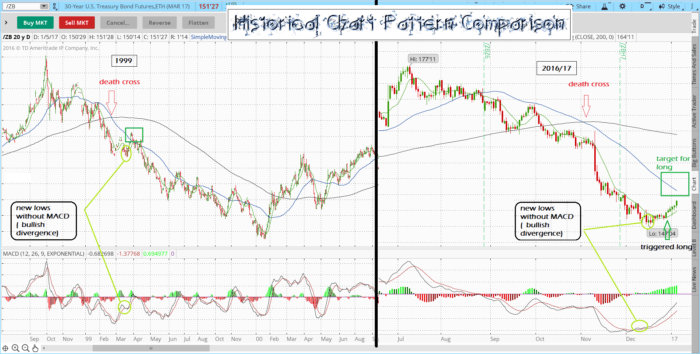
Bonds 1999 vs 2016/17
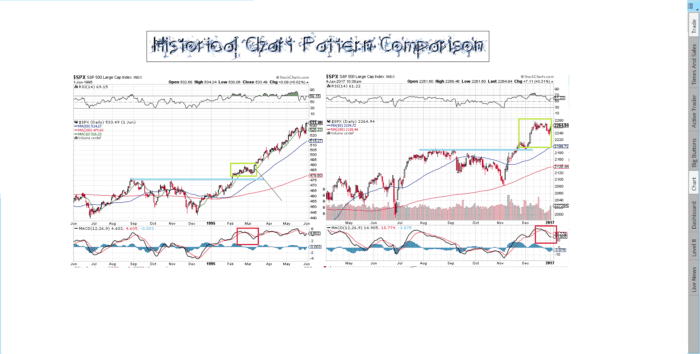
1995 vs 2016/17 SPX
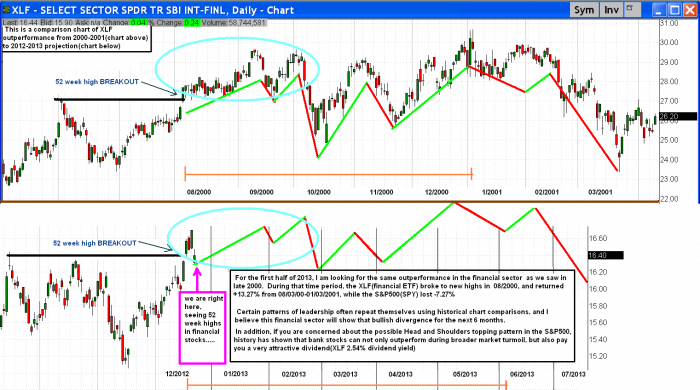
XLF 2000 vs 2013 (posted 12/2012)
Mentioned in Business Insider 1/9/2013
http://www.businessinsider.com/here-are-the-19-charts-to-watch-in-2013-2013-1
David Patrick (@fitzstock2004): Bull In The Financials! 2000 Analog
“David uses 2000 as an analog for what we might see from the financials (XLF) in 2013. Click through on the chart for extensive notes. A good one to follow over the course of the year to see if and how this correlation might unfold.”
https://fitzstock.com/xlf-prediction-1212-new-highs-today/
————————————————————————————————
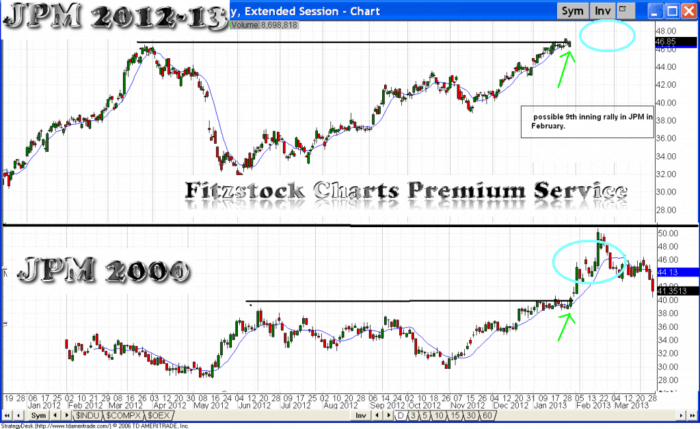
JPM 2000 vs 2012-2013
————————————————————————————————
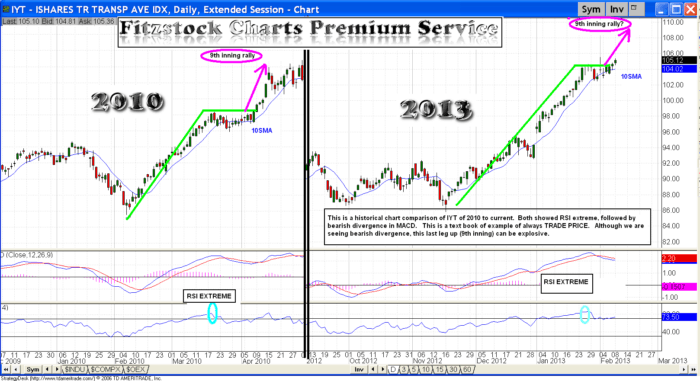
IYT 2010 vs 2013(posted 02/2013)
————————————————————————————————
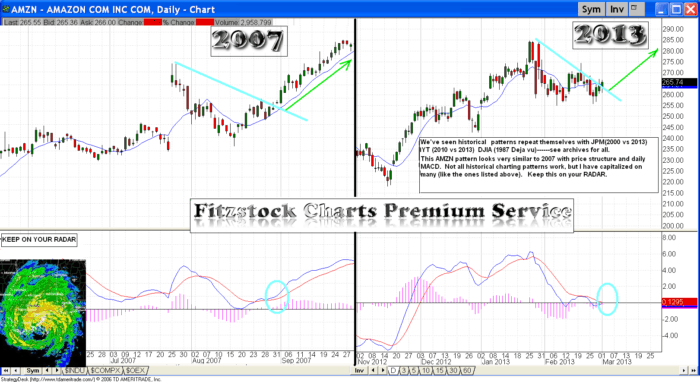
AMZN 2007 vs 2013
————————————————————————————————
DJIA 1987-1991 vs 2008-2013 SPX (posted 03/2013)
————————————————————————————————
CF historical chart comparison (03/2013)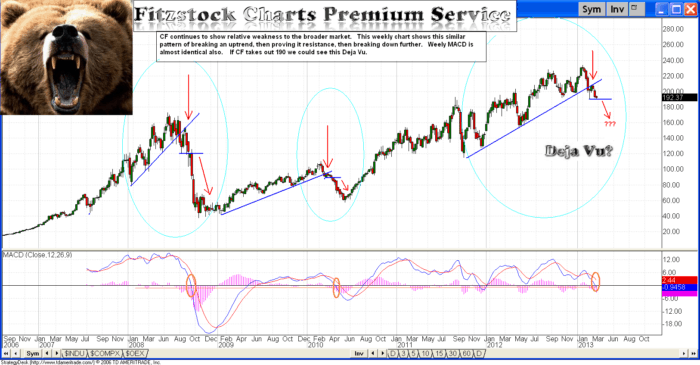
————————————————————————————————
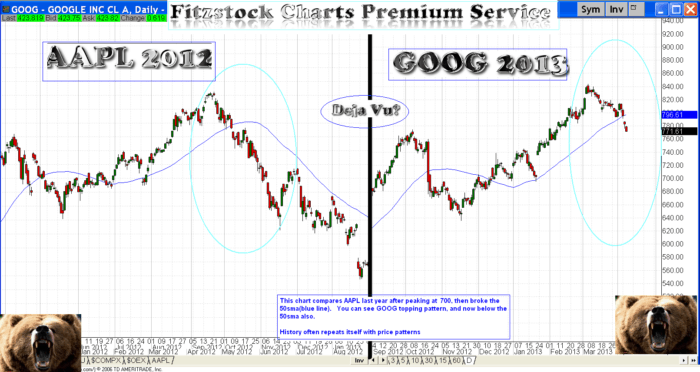
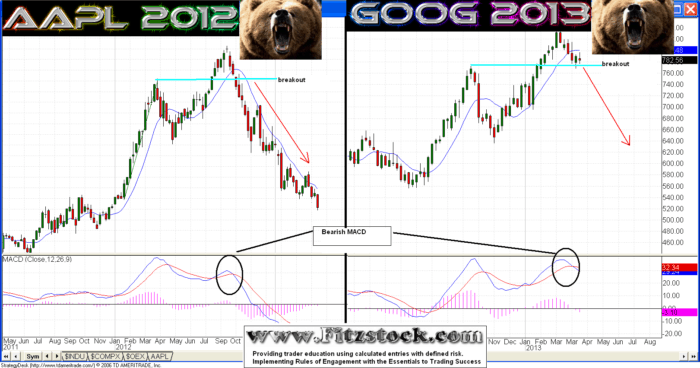
AAPL 2012 vs GOOG 2013 (posted 04/2013)
————————————————————————————————
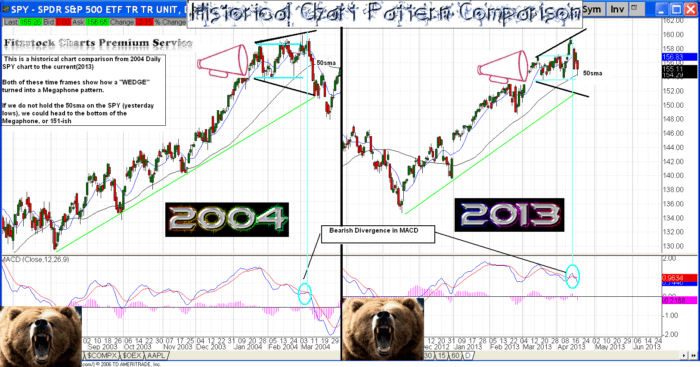
SPX 2004 vs 2013 (posted 04/18/13)
————————————————————————————————
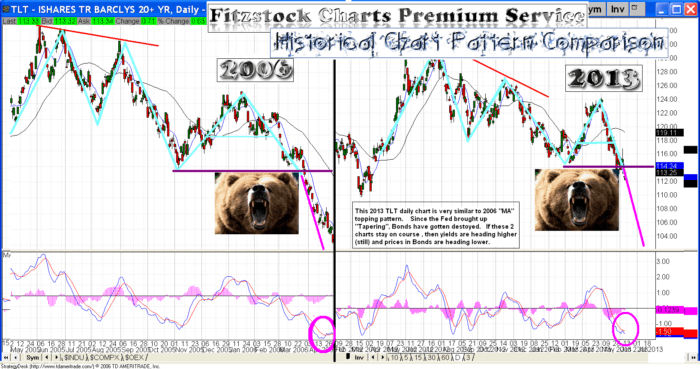
TLT “MA” topping pattern. HCPC to 2006
————————————————————————————————
BABA/LNKD (HCPC) 2015
If you are under performing the stock market with your trades and investments, it is never too late to upgrade to Fitzstock Charts https://www.fitzstock.com/
FOLLOW ME ON SOCIAL MEDIA:
I look forward to helping you meet all your investment and trading goals.
David Patrick
Fitzstock Charts, LLC


