What are the indicators you scan for in your stock screening process?
I get asked this question all the time. I do not use a computer program to find “hot stocks’, but rather do all my scanning manually. This is very time intensive, but the rewards are priceless. There are a million indicators to use and I have tried them all over the last 20 years.
I will tell you a couple things NOT to use, which will shock you.
#1- Volume.
Every trader is brain washed into thinking every meaningful move in a stock has to have volume. I have watched great traders get run over by trains fading moves because there was “no volume” to support it. Volume does not have to come in the form of equity shares traded. Volume can be hidden in option contracts that institutions utilize to become leveraged. So, if you are looking for volume in a specific stock………you might be looking for the wrong thing. Option volume is much more important.
And NO, you do NOT need volume for a sustained move lower or higher. It is just another tool, and usually confuses most traders
#2- RSI/Stochastics/Bollinger Bands
These indicators measure how overbought/oversold a stock can be. However, they are also indicators that measure how solvent you are. Some traders fade big moves based on the reading on these trading tools. What they don’t know is how much “more overbought/oversold” the stock can become. Usually it becomes much more overbought/oversold than you can stay solvent fighting the price direction. Trade the TREND, don’t trade RSI, Stochastics and Bollinger Bands.
Fitzstock Charts uses Price, MACD, Key moving averages, and Trend with multiple time frames. Price structure is the pattern of price in relationship to the key moving averages. Ideally you would like price above 10, 50 and 200sma, with all key moving averages moving higher with price (for long setups). Things become much more tricky when price is trapped between key moving averages and then those key moving averages cross. A Golden Cross is the 50 simple moving average moving up through the 200sma, which is bullish. While the Death Cross is the opposite (50 through 200sma on the downside-bearish), which happened 12/6/18 on the S&P 500. We were able to capitalize on some huge downside moves after that Death cross, using Historical Chart Pattern Comparison (HCPC) and our Rules of Engagement (ROE).
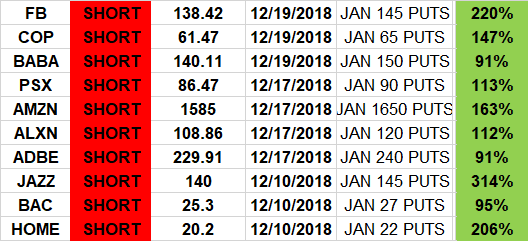
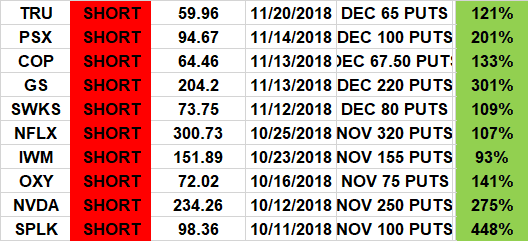
Trades below from our Engagement Spreadsheet Focus List after the Death Cross
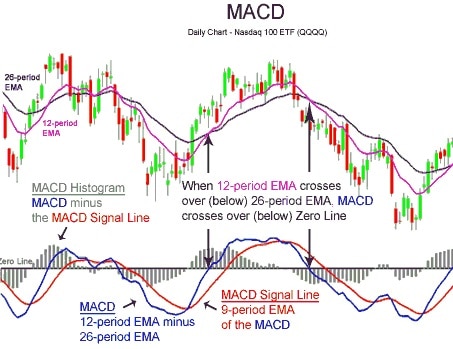
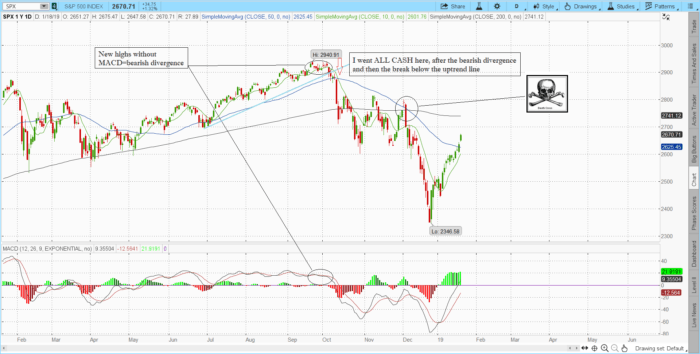
MACD is short for moving average convergence/divergence. It is an oscillator that we use to track price momentum. We also use this momentum indicator to see if price is confirmed on breakouts/breakdowns. If a breakout higher is not confirmed with MACD at highs, you have bearish divergence. If you then break an uptrend after bearish divergence in MACD, you can get some violent moves lower.
In October 10th, 2018 we broke below the uptrend line after bearish divergence in MACD. I went ALL CASH, and we had over 10 different put options double from our Engagement Spreadsheet Focus List.
Fitzstock Charts now has over 1,000 different stock options that have DOUBLED from our suggested entries, while some options have returned over 600%
We are educating traders around the world with our Rules of Engagement (ROE) based on market trend. If you are under performing the stock market with your trades and investments, it is never too late to upgrade.
What does Fitzstock Charts include?
-Daily email updates include our Focus List with calculated entries and defined risk
-Stock chart technical analysis searching for relative strength and weakness
-Weekly video analysis covering our Focus List and the current market conditions
-Educational videos and posts using our trading methodology (ROE)
-Access to private Twitter (@fitzstockcharts) where I post real time updates and trades
Follow me on social media:
Twitter (public): https://twitter.com/Fitzstock2004
Facebook: https://www.facebook.com/fitzstockcharts/
Linkedin: https://www.linkedin.com/in/david-patrick-a0411110a/
YouTube: https://www.youtube.com/watch?v=-yH6PKJa6tU
Learn stock trading and how to day trade stocks with Fitzstock Charts. We scan for historical chart pattern comparisons with trading rules of engagements. The #1 Stock trading consultant in the business, teaching you how to get started trading. Learn how to read stock charts with our key essentials to trading success. We find the best stock charts and implement stock options trading strategies with stock chart technical analysis. If you want learn more stock chart analysis, check out my daily blog updates.
Blog: https://fitzstock.com/how-to-get-started-trading-how-to-day-trade/
We are constantly scanning for the best stocks to buy, best stock to trade, and tell you how to trade stock options.
Fitzstock top links:
Charts: https://fitzstock.com/historical-chart-pattern-comparisons-how-to-read-stock-charts/
Consultations: https://fitzstock.com/stock-trading-consultants-stock-charts-technical-analysis/
Performance: https://fitzstock.com/key-essentials-to-trading-success-stock-options-trading-strategies/
Testimonials:https://fitzstock.com/trading-rules-of-engagement-learn-stock-trading/
I look forward to helping you meet all your investment and trading goals.
David Patrick
Fitzstock Charts, LLC
Stock trading consultants, historical chart pattern comparisons, key essentials to trading success, trading rules of engagement, learn stock trading, how to read stock charts, stock chart technical analysis, how to day trade stocks, how to get started trading, best stock charts, stock chart analysis, stock options trading, stocks to buy now, how to trade stocks,best stocks to buy, how to trade stock options, technical analysis charts, stock trading charts, stock trading service, stock market update, how to trade options, stock trading charts, stock chart analysis, chart patterns, stock chart patterns, stock market technical analysis.


